

What is 360 Monitoring and How Does It Work?
360 Monitoring is a server and website monitoring solution designed to provide real-time insights into performance, availability and resource usage. It continuously checks uptime, response times and server health to help identify potential problems before they affect clients. With detailed reports, alerts and a user-friendly dashboard, businesses can maintain reliable hosting environments and resolve issues quickly.
What does 360 Monitoring do for clients?
360 Monitoring ensures that their websites, applications and servers are always running smoothly. It gives them peace of mind knowing that:
- Downtime detection.
- Performance bottlenecks can be identified and resolved before causing disruptions.
- Alerts are sent in real time so that action can be taken without delay.
- Reports provide transparency about server and application health.
Ultimately it helps businesses deliver consistent service quality, which leads to better client satisfaction.
Key Features of 360 Monitoring
The 360 Monitoring dashboard provides an in-depth view of server statistics and performance metrics. Here are the key sections and what they offer:
Date Range Selection
- At the top of the dashboard, you can set a specific date range for viewing performance data. This allows you to track server activity and performance over time.

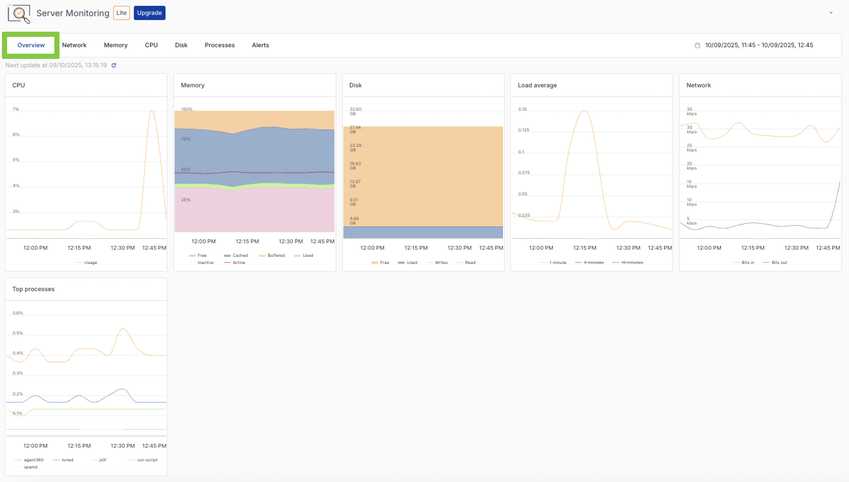
Overview Tab
The overview tab gives a summary of the server’s key resources:
- CPU usage.
- Memory usage.
- Disk space and I/O activity.
- System load averages.
- Network traffic.
- Top running processes.
You can hover over graphs to see precise measurements for each point in time.
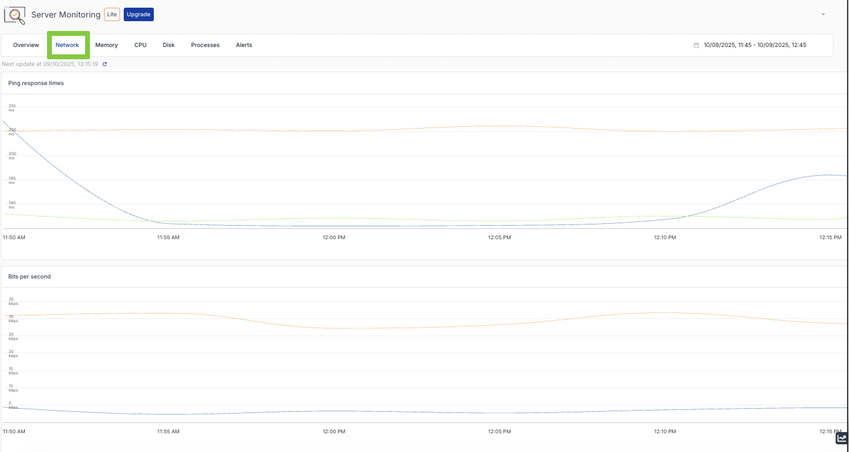
Network Tab
This section focuses on network performance, including:
- Ping response times.
- Bandwidth usage (bits per second).
- Packet statistics.
- Detailed per-adapter traffic graphs.
This helps identify latency or connectivity issues.
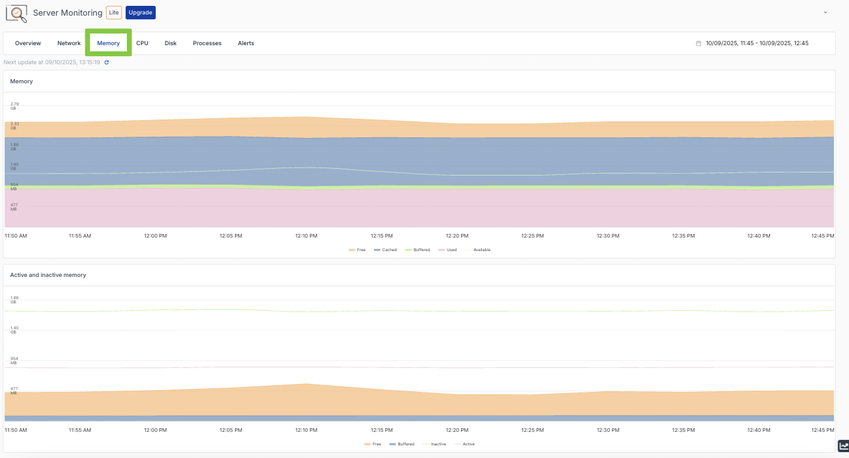
Memory Tab
The Memory tab provides detailed insights into how your server’s memory is being used:
- Total memory consumption.
- Active vs. inactive memory usage.
- Trends in memory allocation over time.
Graphs provide a clear picture of whether applications are consuming excessive memory.
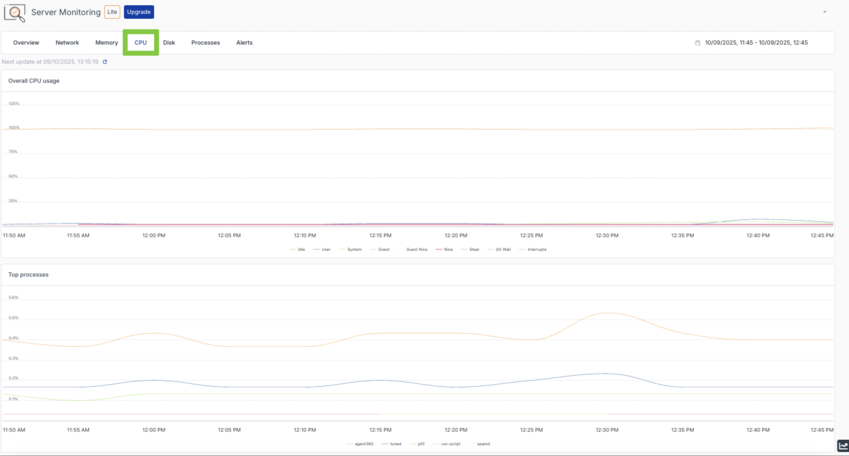
CPU Tab
CPU statistics are broken down into clear visualisations:
- Overall CPU usage across all cores.
- Top processes and their CPU consumption.
- Core-specific performance data.
This makes it easy to detect processes that may be overloading the server.
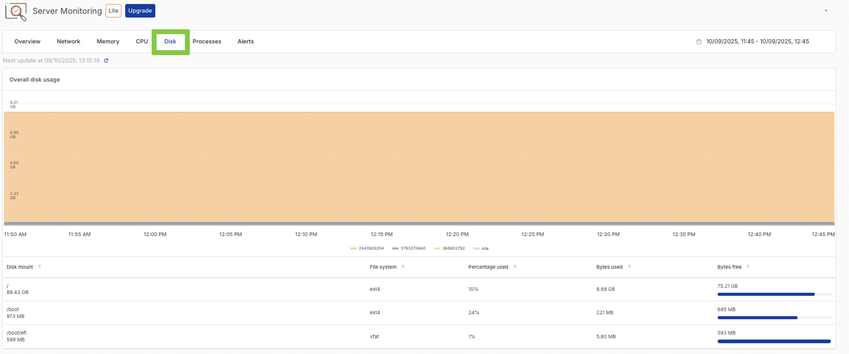
Disk Tab
Storage performance and usage are tracked with several graphs, including:
- Disk usage per mount point.
- Input/output (I/O) transaction counts.
- Read/write data volumes.
This helps detect storage bottlenecks or failing drives.
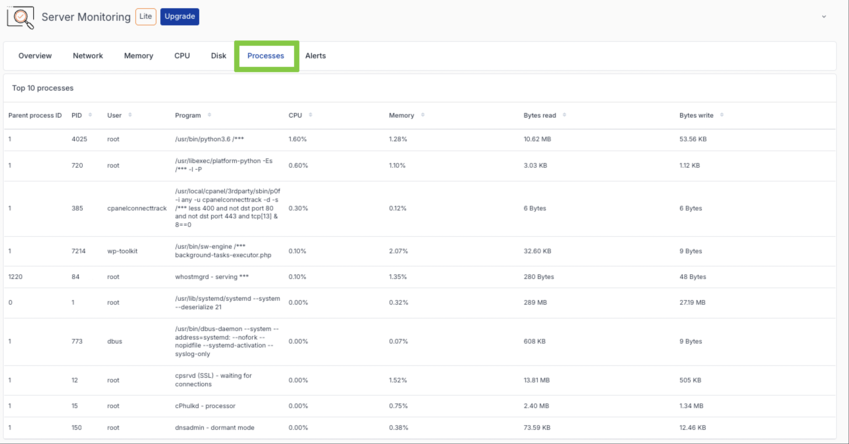
Processes Tab
All running processes are listed along with details such as:
- Process ID (PID).
- User and program information.
- CPU and memory usage per process.
- Disk I/O activity.
You can sort the list or drill down into a process to see more details.
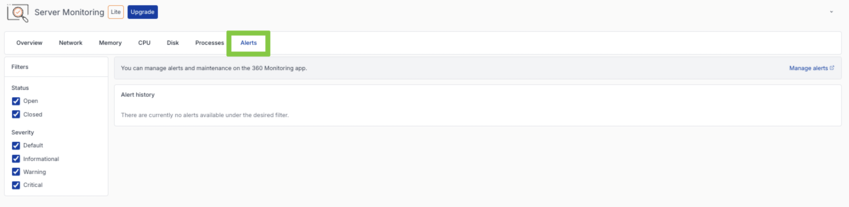
Alerts Tab
Alerts notify you about performance issues or downtime events. The alerts section allows you to:
- Filter alerts by status and severity.
- Review the alert history.
- Manage alert rules and maintenance windows.
This ensures that critical issues are addressed as soon as they occur.
Why Use 360 Monitoring?
- 360 Monitoring is an essential tool for hosting providers, IT teams and businesses that rely on servers for daily operations. By offering detailed insights, real-time alerts and historical performance tracking, it minimises downtime and ensures systems are always running at peak performance.